Philippine Macroeconomic Baseline: What Q1 2026 Data Means for Infrastructure Investors
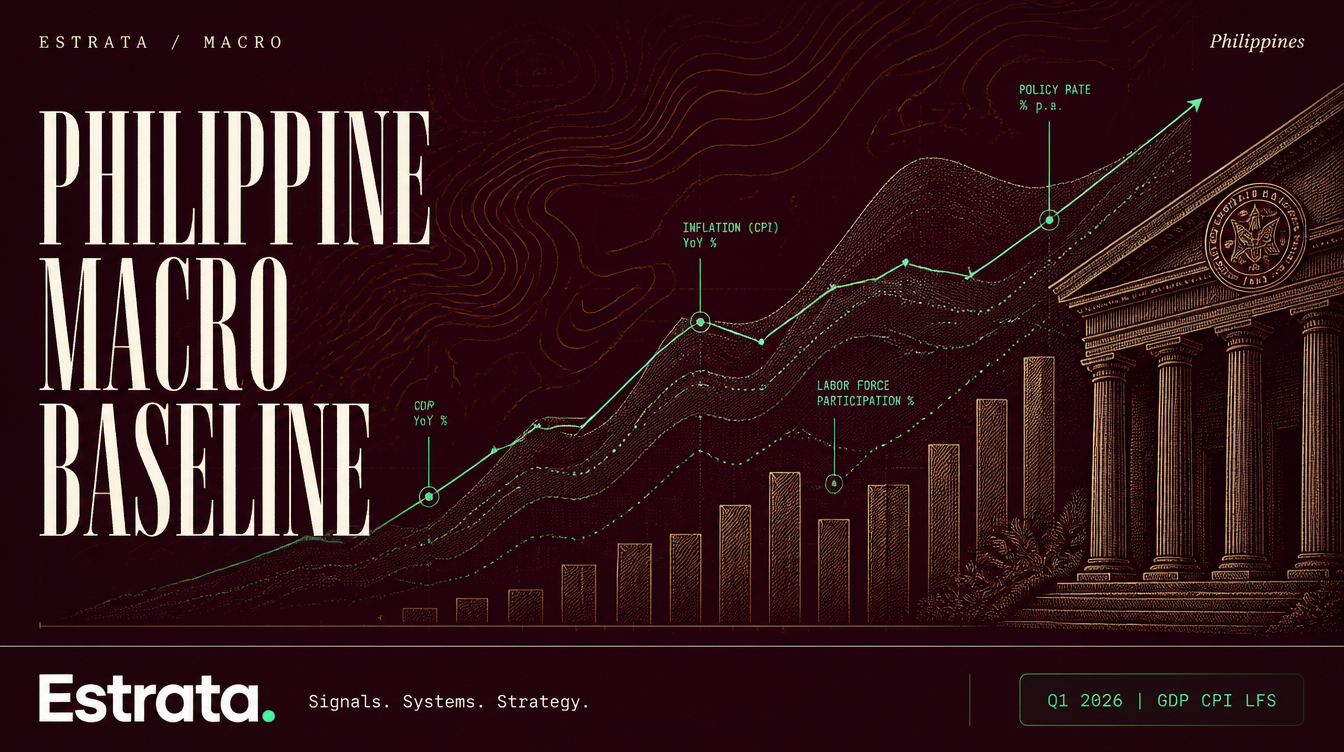
Recent PSA releases on GDP (Q1 2026 National Accounts), labor markets, and inflation provide the official baseline for assessing Philippine investment conditions. The numbers frame demand, cost pressures, and the political appetite for continued infrastructure spending.
Key takeaways
- Official data anchors investment decisions. The PSA's quarterly National Accounts, monthly CPI, and periodic Labor Force Survey form the evidentiary foundation that the BSP, NEDA, and DBM use to set monetary policy, approve flagship projects, and calibrate fiscal spending.
- GDP growth trajectory matters for infrastructure. A Q1 print above or below consensus directly affects the cost of capital, revenue projections for Build Better More concessions, and the fiscal space available for new project approvals.
- Inflation determines the rate environment. The BSP policy rate (the overnight reverse repurchase rate) responds to CPI trends. A sustained disinflation path creates room for rate cuts, reducing the discount rate on long-dated infrastructure cash flows.
- Labor market slack or tightness signals construction input costs. The Labor Force Survey reveals whether the construction sector faces wage pressure (tight labor market) or has ample capacity to absorb new infrastructure spending without overheating.
Why macroeconomic data is infrastructure intelligence
Infrastructure investment in the Philippines operates at the intersection of three forces: the government's willingness to spend (fiscal policy), the cost of borrowing (monetary policy), and the capacity of the domestic economy to absorb new construction without inflating input costs (labor and materials markets).
All three forces are measured, reported, and forecast using the PSA's official statistical releases. For an investor assessing a 25-year toll road concession or a 15-year renewable energy power supply agreement, the macroeconomic baseline is not background noise. It is the first assumption in every financial model.
The Q1 2026 National Accounts release from PSA provides the headline GDP growth figure.1 This number is decomposed by sector (agriculture, industry, services) and by expenditure (household consumption, government spending, capital formation, net exports). The government spending component reveals whether the DBM is executing the national budget on schedule. The capital formation component reveals whether private construction and equipment investment is accelerating or decelerating.
The CPI release provides the official inflation gauge.2 The BSP targets inflation at 2 to 4 percent. When CPI prints above the upper bound, the Monetary Board tightens by raising the policy rate. When it prints within or below the band, the Board has room to ease. Infrastructure projects financed with peso-denominated debt are directly exposed to this rate cycle.
The Labor Force Survey rounds out the picture.3 Unemployment, underemployment, and labor force participation rates reveal whether the Philippine workforce is fully utilized or operating with slack. For infrastructure construction, a tight labor market means rising wages for skilled trades (heavy equipment operators, electricians, welders). A loose labor market means stable or falling real wages, improving project margins.
What the data means for the Build Better More pipeline
The Build Better More program now comprises 185 Infrastructure Flagship Projects (IFPs) with a combined estimated cost exceeding PHP 9 trillion. These projects span transport (rail, airports, seaports), water resources (dams, irrigation), energy (transmission, generation), and digital connectivity (broadband, data centers).
Macroeconomic conditions determine which of these projects proceed and at what pace:
- GDP growth above 6 percent expands the fiscal envelope. Strong growth generates tax revenue, reducing the deficit-to-GDP ratio and creating room for additional project approvals without triggering credit rating concerns.
- Inflation within the 2 to 4 percent target band allows the BSP to keep rates low or cut them. This reduces the government's borrowing cost (important for a program financed partly through official development assistance and partly through domestic borrowing) and improves the internal rate of return on PPP concessions.
- Stable or improving employment supports household consumption, which feeds back into GDP growth, sustaining the virtuous cycle that makes infrastructure spending politically popular and fiscally sustainable.
When any of these indicators move against the baseline, the pipeline adjusts. Projects get re-phased. Concession terms get renegotiated. Financing assumptions get stress-tested. Tracking the PSA data is the first step in anticipating these adjustments.
Risk factors
The primary macro risk for Philippine infrastructure investors is a sustained inflation overshoot that forces the BSP into a prolonged tightening cycle. This scenario raises the cost of debt service for both the national government and PPP concessionaires, compresses project IRRs, and shifts investor preference toward shorter-duration assets.
A secondary risk is a growth slowdown that constrains the fiscal envelope. If GDP growth falls below 5 percent, the DBM and NEDA face pressure to prioritize recurrent spending (salaries, social services) over capital outlays, delaying new project approvals.
A third risk is external: a global risk-off event that triggers capital outflows from emerging markets, weakening the peso and raising imported inflation (particularly for fuel and construction materials). This scenario combines all the negative forces: higher rates, higher input costs, and reduced fiscal flexibility.
Footnotes
-
PSA National Accounts Q1 2026. Published quarterly by the Philippine Statistics Authority. https://psa.gov.ph/statistics/national-accounts [cached: https://webcache.googleusercontent.com/search?q=cache:psa.gov.ph/national-accounts] ↩
-
PSA Consumer Price Index and Inflation Report. Published monthly. https://psa.gov.ph/price-indices/cpi-ir [cached: https://webcache.googleusercontent.com/search?q=cache:psa.gov.ph/price-indices/cpi-ir] ↩
-
PSA Labor Force Survey. Published periodically. https://psa.gov.ph/statistics/labor-force-survey [cached: https://webcache.googleusercontent.com/search?q=cache:psa.gov.ph/statistics/labor-force-survey] ↩